AMOLED Display Market Track, just issued – Market Performance, Market Forecast, ASP, Supply and Demand Analysis

According to the market performance data of the AMOLED Display Market Track published by UBI Research in February 2018, total AMOLED shipments and sales in 2017 were recorded as 440 million units and US$ 27.1 billion, up 13.6% and 62.3% respectively, compared to the previous year.

The number of AMOLED smart phone shipments grew to 95.1% in the total AMOLED market in 2017, and its market share for the revenue was 89.7%. The number of shipments of flexible AMOLEDs reached 140 million units in 2017, increased by 2.1 times compared to the previous year.  Analysis shows that shipments of flexible AMOLEDs will reach 230 million units by 2018, with a share of 46%.

AMOLED shipments for TVs grew by 1.8 times YoY to 1.72 million units in 2017, and the AMOLED market for TV is expected to continue to grow, as LG Display’s 8 G plant in China is scheduled to start operation from 2H 2019.
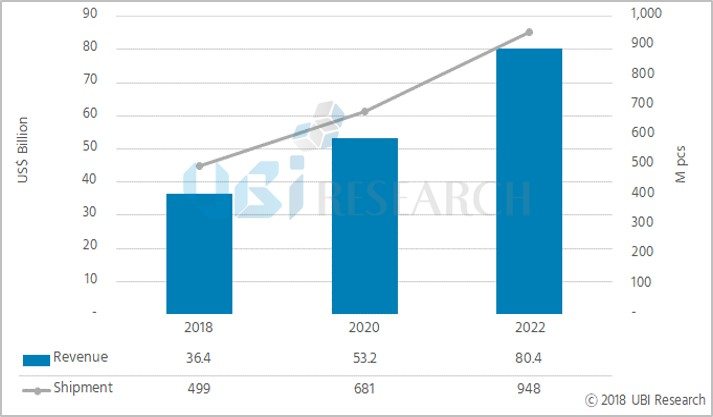
<Overall AMOLED Market Forecast>

From 2018, AMOLED market is forecasted to change significantly.

In terms of supply, shipments of displays are projected to decline compared to the global capacity of display makers due to the accelerated increase in the size of AMOLED panels and Samsung Display’s shift of rigid AMOLED lines into automotive and foldable applications.

In terms of demand, the demand growth for AMOLED panels for smartphones is expected to decrease. In 2018, demand for flexible AMOLED panels for Chinese set makers is expected to decrease due to the introduction of low-priced full screen LCDs and rising prices of flexible AMOLED panels.

According to the market forecast data of AMOLED Display Market Track, the total AMOLED shipment market is expected to grow at a CAGR of 17.5%, reaching 995 million units in 2022. The revenue is projected to grow at a CAGR of 22%, forming a market of US$ 80.5 billion in 2022.
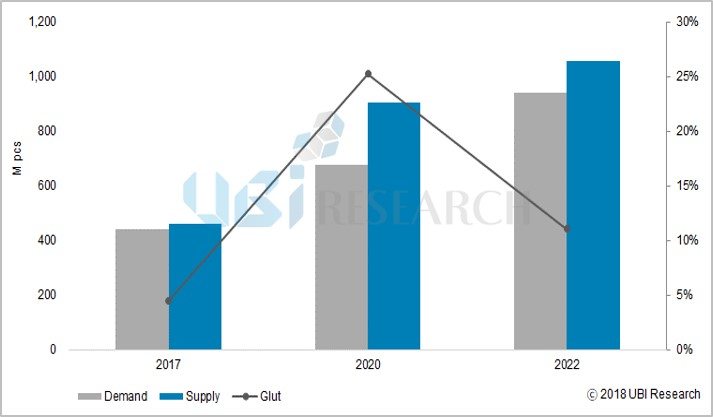
<Small and Medium sized AMOLED, Supply and Demand Analysis>

According to Yi Choong-Hoon, CEO of UBI Research, “20% oversupply is expected to occur by 2021, however, since then, panel prices have fallen due to the entry of Chinese panel makers into the flexible AMOLED market, and oversupply will decrease by 11% in 2022 “.

Meanwhile, AMOLED Display Market Track, which was published on February 12, 2018, covers AMOLED market performance and forecast by quarter, year and application. It also provides data and graphs analyzed in various aspects such as ASP and supply & demand analysis.

AMOLED Display Market Track – Market Performance, Market Forecast, ASP, Supply and Demand Analysis 발간

유비리서치가 2018년 2월에 발간한 AMOLED Display Market Track의 market performance 데이터에 따르면 2017년 전체 AMOLED 출하량은 4.4억 대, 매출액은 271억 달러로 전년 대비 각각 13.6%, 62.3% 증가한 것으로 집계되었다.

2017년 스마트폰용 AMOLED 출하량 점유율은 AMOLED 전체 시장에서 95.1%로 나타났으며, 매출액 점유율은 89.7%를 기록했다. 2017년 flexible AMOLED의 출하량은 전년 대비 약 2.1배 증가한 1.4억 대를 기록하였고, 2018년에는 flexible AMOLED의 출하량이 2.3억 대의 규모를 형성하며 점유율이 약 46%까지 증가할 것으로 분석 됐다.

2017년 TV용 AMOLED 출하량은 전년 대비 약 1.8배 증가한 172만 대를 기록하였으며, LG Display의 중국 8세대 공장이 2019년 하반기부터 가동될 것으로 예상되어 TV용 AMOLED 시장은 지속적인 성장을 보일 것으로 전망 된다.

<전체 AMOLED 시장 전망>

2018년부터는 AMOLED 시장에 큰 변화가 생길 것으로 전망된다.

공급측면에서는 스마트폰용 AMOLED panel의 size 증가 가속화와 Samsung Display rigid AMOLED 라인의 automotive와 foldable용 전환으로 전세계 디스플레이 업체의 생산능력 대비 출하량이 감소할 것으로 예상된다.

수요측면에서도 스마트폰용 AMOLED panel의 수요 증가 폭이 줄어들 것으로 전망된다. 2018년은낮은 가격의 full screen LCD의 등장과 flexible AMOLED panel 가격 상승으로 중국 set 업체들의 flexible AMOLED panel 수요가 감소할 전망이다.


AMOLED Display Market Track의 market forecast 데이터에 따르면 전체 AMOLED 출하량 시장은 2022년까지 연평균 17%로 성장하여 약 9.5억 대 규모가 될 것으로 예상되며, 매출액 시장은 2022년까지 연평균 22%로 성장하여 805억 달러 규모의 시장을 형성할 것으로 예상했다.

<중소형 AMOLED Supply and Demand Analysis>

유비리서치 이충훈대표에 의하면 “2021년까지 20%대의 공급과잉이 발생할 것으로 예상되지만 그 이후부터는 중국 패널 업체들이 Flexible AMOLED 시장에 진입함에 따라 패널 가격이 하락하여 2022년에는 공급과잉이 11%까지 감소할 것”이라고 전망했다.


한편, 2018년 2월에 발간된 AMOLED Display Market Track에서는 AMOLED 시장 실적과 전망을 분기별과 연도별, application별로 상세하게 다루고 있으며, ASP와 supply and demand analysis 등 다양한 측면에서 분석한 data와 그래프를 엑셀 형태로 제공하고 있다.

AMOLED Display Market track – Investment & MP Line Status, just published

According to the investment trend data from AMOLED Display Market Track published by UBI research, the net area capacity of AMOLED production worldwide is expected to grow at a CAGR of 48% from 2018 to 2020.

As a result of analyzing the glass area based on the overall equipment capacity, the net area capacity of AMOLED mass production was 13 million square meters in 2017, and it is expected to grow more than three times to 40 million square meters in 2020.

The net area capacity of AMOLED mass production area is projected to grow from 4 million square meters in 2017 to 8.4 million square meters in 2020, and that of small and medium-sized AMOLED is to be increased about 3.5 times from 9.1 million square meters in 2017 to 32 million square meters in 2020.

Analysis shows that LG Display’s net area capacity will be increased by 6.9 million square meters from 2018 to 2020, followed by Samsung Display with 5.8 million square meters increase and BOE with 4.4 million square meters increase.

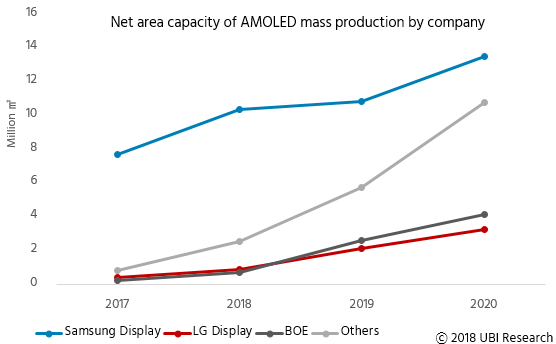
On the other hand, when compared to the net area capacity for small and medium-sized AMOLED, Samsung Display is expected to increase by 5.8 million square meters, with the largest investment, followed by BOE of 4 million square meters’ increase and LG Display of 2.9 million square meters increase.

<Net area capacity of AMOLED mass production by company>

According to Lee Choong Hoon, CEO of UBI Research, LG Display’s AMOLED mass production line investment in China will lead LGD to more than double BOE’s AMOLED production capacity in terms of net area capacity in 2020, however, BOE is expected to overtake LG Display at small and medium-sized panel capacity in 2019.

AMOLED Display Market Track consists of investment data, market performance, market forecast, ASP, cost analysis, competitiveness analysis and so on. The investment data in this report contains details of the investment history of the panel companies, current status, and investment prospects for the next three years. Also, the useful data and graphs analyzed in various aspects are provided in excel format.

AMOLED Display Market track – Investment & MP Line Status 발간

유비리서치에서 발간한 AMOLED Display Market Track의 투자 동향 데이터에 따르면 전세계 AMOLED 생산 가능 면적은 2018년부터 2020년까지 연평균 48%로 성장할 전망이다.

장비 capa에 따른 glass 면적을 분석한 결과, 2017년 AMOLED의 양산 가능 면적은 1,300만 ㎡ 이었지만 2020년에는 약 3배 이상 증가한 4,000만 ㎡가 될 전망이다.

대면적 AMOLED 양산 가능 면적은 2017년 400만 ㎡에서 2020년 840만 ㎡로 약 2배 가량 증가 하며, 중소형 AMOLED 양산 가능 면적은 2017년 910만 ㎡에서 2020년 3,200만 ㎡로 약 3.5배 증가할 것으로 전망된다.

업체별로는 LG디스플레이가 2018년부터 2020년까지 전체 AMOLED 양산 가능 면적이 690만 ㎡ 증가하여 가장 높은 증가세를 보였으며, 뒤이어 삼성디스플레이가 580만 ㎡, BOE가 440만 ㎡ 증가할 것으로 분석 됐다.

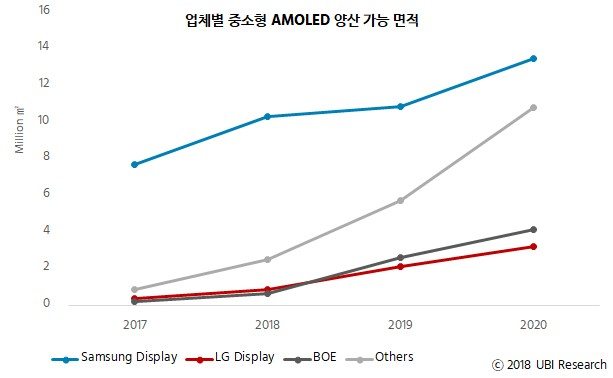
한편, 중소형 AMOLED 양산 가능 면적만 비교해보면 삼성디스플레이가 580만 ㎡ 증가하여 투자가 가장 많을 전망이며, 뒤이어 BOE가 400만 ㎡, LG디스플레이가 290만 ㎡ 증가할 것으로 분석 됐다.

<업체별 중소형 AMOLED 양산 가능 면적>

유비리서치 이충훈 대표에 따르면 LG디스플레이의 중국 대면적 AMOLED 양산라인 투자로 2020년 전체 AMOLED 생산 가능 면적에서는 LG디스플레이가 BOE 대비 2배 이상 앞선다. 하지만 중소형에서는 생산 가능 면적에서 2019년부터 BOE가 LG디스플레이를 추월할 전망이다.


AMOLED Display Market Track은 investment data, market performance, market forecast, ASP, cost analysis, competitiveness analysis 등으로 구성되어 있다. 이번에 발간한 investment data에는 업체들의 투자 히스토리와 현 상황, 3년 후의 투자 전망에 대한 부분을 라인별로 상세히 담고 있으며, 다양한 측면에서 분석한 data와 그래프를 엑셀 형태로 제공한다.